Control · Cost Control

The forecast updates when the invoice is approved  not when the report is due.

PROBIS Control removes the lag entirely: approvals, change orders and progress feed the cost report, the forecast, the cash flow and the liquidity position as they occur. The month-end report becomes a printout of something you already knew.

Supercharge Your Current ERP

PROBIS connects instantly to SAP, Yardi, Oracle, and MS Dynamics to pull the insights you need without disrupting your workflow.

Denver Tower II — Cost report · live · PROBIS Control
Cost report
Invoices
Detail report
Cash flow
Liquidity
Budget
$203.1M
Committed
$156.5M
Invoiced
$108.6M
Forecast
$206.1M
Variance
−$3.0M
Budget consumption
as of Aug 21, 2026 · gross
Invoiced $108.6M
Committed, not yet invoiced $47.9M
Unawarded $46.6M
Cost group
Budget
Committed
Invoiced
Forecast
Variance
03–09 Shell & core
121,000,000
96,000,000
67,000,000
123,100,000
−2,100,000
21–28 MEP
46,000,000
38,200,000
24,600,000
47,300,000
−1,300,000
31–33 Sitework
9,500,000
4,500,000
2,200,000
9,300,000
+200,000
01 Soft costs
26,600,000
17,800,000
14,800,000
26,400,000
+200,000
Total
203,100,000
156,500,000
108,600,000
206,100,000
−3,000,000
Control · Cost Control

Die Prognose aktualisiert sich mit der Freigabe  nicht zum Berichtstermin.

PROBIS Control schließt die Lücke zwischen Ereignis und Auswertung: Freigaben, Nachträge und Baufortschritt fließen unmittelbar in Kostenbericht, Prognose, Cashflow und Liquidität ein. Der Monatsbericht ist damit nur noch der Ausdruck dessen, was Sie bereits wissen.

Mehr aus Ihrem bestehenden ERP herausholen

PROBIS verbindet sich direkt mit  SAP, MS Dynamics, Oracle und Yardi und liefert die Kennzahlen, die Sie brauchen – ohne Ihre Abläufe zu stören.

Frankfurt Tower II — Kostenbericht · live · PROBIS Control
Kostenbericht
Rechnungen
Detailbericht
Cashflow
Liquidität
Budget
186,8 Mio. €
Beauftragt
143,9 Mio. €
Abgerechnet
99,8 Mio. €
Prognose
189,7 Mio. €
Abweichung
−2,9 Mio. €
Budgetausschöpfung
Stand 21.08.2026 · brutto
Abgerechnet 99,8 Mio. €
Beauftragt, noch nicht abgerechnet 44,1 Mio. €
Noch nicht vergeben 42,9 Mio. €
Kostengruppe
Budget
Beauftragt
Abgerechnet
Prognose
Abweichung
300 Bauwerk – Baukonstruktionen
111.300.000
88.300.000
61.600.000
113.300.000
−2.000.000
400 Bauwerk – Technische Anlagen
42.300.000
35.100.000
22.600.000
43.500.000
−1.200.000
500 Außenanlagen
8.700.000
4.100.000
2.000.000
8.600.000
+100.000
700 Baunebenkosten
24.500.000
16.400.000
13.600.000
24.300.000
+200.000
Gesamt
186.800.000
143.900.000
99.800.000
189.700.000
−2.900.000
What Control covers
Four readings · one set of transactions
OverviewCost report · invoices · forecast+

The live cost position: budget, commitments, invoices and forecast to complete on one screen, recalculated on every approval. Invoice workflows, the detail report and the cost-to-complete bridge all read from the same transactions, so the month-end report is a printout of something you already knew.

See the cost report and invoice workflow →
CAPEX/OPEXTen-year and rolling budgets+

Same engine, longer horizon. Plan investment and operating budgets at asset, sub-area or measure level across ten-year or evergreen models, with measures captured, prioritized, approved and released through a workflow — so the annual budget is a decision record rather than a negotiation.

See the ten-year measure matrix →
Cash FlowOutflow from contract terms+

Payment schedules come from the contracts you signed — retainage, installment terms, payment periods and approved change orders all shape the outflow curve automatically, and actual invoices reshape it as they arrive. Read the profile at project, phase or portfolio level.

See plan versus actual outflow →
LiquidityDraws · cover · shortfall date+

Equity and debt draws modeled against the forecast outflow, with funding cover shown forward and the point where the requirement exceeds the facility flagged automatically. Equity-first, pro-rata or bespoke sequences match the loan agreement rather than approximating it.

See the funding cover model →
Leistungsumfang von Control
Vier Sichten · ein Datenbestand
ÜberblickKostenbericht · Rechnungen · Prognose+

Die aktuelle Kostenlage: Budget, Beauftragungen, Rechnungen und Kostenprognose auf einer Oberfläche, neu berechnet mit jeder Freigabe. Rechnungsworkflow, Detailbericht und Prognoserechnung greifen auf denselben Datenbestand zu.

Kostenbericht und Rechnungsworkflow ansehen →
CAPEX/OPEXZehnjahres- und rollierende Budgets+

Gleiche Systematik, längerer Horizont. Planen Sie Investitions- und Betriebsbudgets auf Objekt-, Teilbereichs- oder Maßnahmenebene, in Zehnjahres- oder rollierenden Modellen. Maßnahmen werden erfasst, priorisiert, genehmigt und über einen Workflow freigegeben.

Zehnjahres-Maßnahmenmatrix ansehen
CashflowAuszahlungen aus Vertragskonditionen+

Die Zahlungspläne kommen aus Ihren Verträgen: Sicherheitseinbehalte, Ratenvereinbarungen, Zahlungsfristen und genehmigte Nachträge formen die Auszahlungskurve automatisch, eingehende Rechnungen passen sie an. Auswertung auf Projekt-, Phasen- oder Portfolioebene.

Plan-Ist-Vergleich der Auszahlungen ansehen
LiquiditätAbrufe · Deckung · Unterdeckung+

Eigen- und Fremdkapitalabrufe werden gegen die prognostizierten Auszahlungen modelliert. Die Finanzierungsdeckung wird fortgeschrieben, die Unterdeckung automatisch markiert. Eigenkapital-zuerst, pro rata oder individuelle Abrufreihenfolgen entsprechen dem Kreditvertrag.

Finanzierungsdeckung ansehen

How it works

01

Receive

Invoice or document arrives; PROBIS reads it and matches it to the contract.

02

Route

The approval workflow assigns it to the right people in the right order.

03

Approve

Amounts are approved, corrected or rejected. Status moves to approved, then paid.

04

Recalculate

Budget, cost-to-complete, cash flow and liquidity all move on the same event.

05

Report

Pull the view any stakeholder needs — no assembly required.

So funktioniert es

01

Eingang

Rechnung oder Dokument geht ein; PROBIS liest die Daten und ordnet sie dem Vertrag zu.

02

Zuweisung

Der Freigabeworkflow leitet den Beleg in der festgelegten Reihenfolge weiter.

03

Freigabe

Beträge werden freigegeben, korrigiert oder abgelehnt. Status: freigegeben, dann bezahlt.

04

Neuberechnung

Budget, Kostenprognose, Cashflow und Liquidität aktualisieren sich im selben Schritt.

05

Auswertung

Jede Sicht auf Abruf — ohne manuelle Zusammenstellung.

One model, different points of view

Ein Datenmodell, verschiedene Perspektiven

The three-week lag

Today

  • The cost report is assembled by hand at month end from several sources that disagree.
  • Invoices sit in email or on desks; nobody can say what is pending approval or for how long.
  • The cash-flow forecast is a separate spreadsheet, updated less often than the cost report.
  • By the time a variance is visible in a report, the decision that caused it is two months old.

With PROBIS

  • The cost report is a live view. Producing it takes as long as choosing your filters.
  • Every invoice is in a workflow, with a status, an owner and an elapsed time.
  • Cash flow and liquidity are derived from the same commitments and approvals as the cost report — so they cannot disagree with it.
  • The variance appears the moment it is caused, attached to the transaction that caused it.

Der Rückstand von drei Wochen

Heute

  • Der Kostenbericht wird zum Monatsende manuell aus mehreren Quellen zusammengestellt, die voneinander abweichen.
  • Rechnungen liegen in Postfächern oder auf Schreibtischen; niemand kann sagen, was seit wann zur Freigabe aussteht.
  • Die Cashflow-Prognose ist eine separate Tabelle und wird seltener aktualisiert als der Kostenbericht.
  • Wenn eine Abweichung im Bericht sichtbar wird, liegt die auslösende Entscheidung zwei Monate zurück.

Mit PROBIS

  • Der Kostenbericht ist eine Live-Auswertung. Die Erstellung dauert so lange, wie Sie Filter setzen
  • Jede Rechnung läuft in einem Workflow — mit Status, Zuständigkeit und Liegezeit.
  • Cashflow und Liquidität leiten sich aus denselben Beauftragungen und Freigaben ab wie der Kostenbericht — Abweichungen zwischen den Auswertungen sind damit ausgeschlossen.
  • Die Abweichung erscheint im Moment ihrer Entstehung — mit Bezug zum auslösenden Vorgang.

Invoices that control themselves

  • Automatic data recognition from uploaded invoices and documents
  • Multi-step approval workflows with teams, roles and automatic triggers
  • Batch workflows for high-volume, low-value invoice runs
  • Invoice cover sheet with verification stamp and full audit trail
  • Status through to approved and paid, with a task overview per user
Invoice approval — INV-2026-0418 · Brandner Electric LLC
invoice_0418.pdf
Recognized fields
OCR · 98% confidence
Supplier
Brandner Electric LLC
Invoice number
INV-2026-0418
Gross
$454,080.00
Retainage 10%
−$45,408.00
Contract match
C-0117 · Electrical · section 26 05 00 — matched
Step 1 · Technical
Approved
M. Keller · Aug 19
Step 2 · Commercial
Pending 4 days
A. Sanders · due Aug 23
Step 3 · Release
Not started
Finance team
Budget impact
26 05 00 · 71% used
Cover sheet
Stamped
Batch run
18 routine invoices

A cost position you can slice any way you're asked

  • Detail report across contracts, sections, taxonomy and cost structure
  • Gross and net-of-retainage views on the same data
  • Widget reports that look like a dashboard but behave like a report
  • Export to PNG, PDF, Excel or Power BI
  • Variance reporting against budget, forecast and any prior version
Detail report — cost transactions · data cube
CSI division
21–28
Cost center
DEN-02
Location
Tower B
Engineer of record
Meridian MEP
Period
Q3 2026
1,284 transactions · 42 contracts
Gross
Net of retainage
Transaction
Contract
Section
Date
Gross
INV-2026-0418 · Brandner
C-0117
26 05 00
08/19/26
454,080
INV-2026-0402 · Northline
C-0104
23 05 00
08/14/26
315,095
CO-11 · riser relocation
C-0104
23 05 00
08/11/26
71,390
INV-2026-0388 · Weiss
C-0122
22 10 00
08/07/26
144,342
INV-2026-0371 · Summit
C-0130
14 20 00
08/02/26
240,900
Selection total
1,225,807
Export · PNG / PDF / XLSX / Power BI
Variance vs. forecast v7: −0.6%

Forecast to complete, not extrapolation from spend

  • Cost-to-complete per cost group and for the project as a whole
  • Forecast drift tracked against previous versions and snapshots
  • Committed / paid / remaining position visible continuously
  • Milestone trend analysis linking cost movement to schedule movement
Cost to complete — bridge from budget to forecast
Budget → forecast ($M, gross)
Forecast v8 · Aug 21, 2026
203.1
108.6
47.9
46.6
−3.0
Budget
Paid
Committed, not invoiced
Unawarded
Forecast variance
Cost to complete
$97.5M
Forecast to complete
$206.1M
Drift vs. v7
+$1.0M

Rechnungen, die sich selbst steuern

  • Automatische Datenerkennung aus hochgeladenen Rechnungen und Dokumenten
  • Mehrstufige Freigabeworkflows mit Teams, Rollen und automatischen Auslösern
  • Sammelworkflows für Rechnungen mit geringem Wert und hoher Stückzahl
  • Rechnungsdeckblatt mit Prüfstempel und vollständiger Historie
  • Status bis freigegeben und bezahlt, mit Aufgabenübersicht je Benutzer
Rechnungsfreigabe — RE-2026-0418 · Brandner Elektrotechnik GmbH
rechnung_0418.pdf
Erkannte Felder
OCR · 98 % Sicherheit
Lieferant
Brandner Elektrotechnik GmbH
Rechnungsnummer
RE-2026-0418
Brutto
417.600,00 €
Sicherheitseinbehalt 10 %
−41.760,00 €
Vertragszuordnung
V-0117 · Elektro · KG 440 Starkstromanlagen — zugeordnet
Schritt 1 · Technische Prüfung
Freigegeben
M. Keller · 19.08.
Schritt 2 · Kaufmännische Prüfung
Seit 4 Tagen offen
A. Schneider · fällig 23.08.
Schritt 3 · Freigabe
Nicht begonnen
Buchhaltung
Budgetwirkung
KG 440 · 71 % verbraucht
Deckblatt
Gestempelt
Sammellauf
18 Routinerechnungen

Eine Kostenlage, die jede Auswertung zulässt

  • Detailbericht über Verträge, Titel, Taxonomie und Kostenstruktur
  • Netto- und Bruttosicht auf denselben Datenbestand
  • Widget-Berichte im Dashboard-Layout mit der Prüffähigkeit eines Berichts
  • Export nach PNG, PDF, Excel oder Power BI
  • Abweichungsanalyse gegen Budget, Prognose und jeden früheren Stand
Detailbericht — Kostenvorgänge · Datenwürfel
Kostengruppe
400
Kostenstelle
FRA-02
Bauabschnitt
Turm B
Fachplaner
Meridian TGA
Zeitraum
Q3 2026
1.284 Vorgänge · 42 Verträge
Brutto
Abzgl. Einbehalt
Vorgang
Vertrag
Kostengruppe
Datum
Brutto in €
RE-2026-0418 · Brandner
V-0117
440
19.08.26
417.600
RE-2026-0402 · Nordluft
V-0104
430
14.08.26
289.890
NT-11 · Steigestrang-Verlegung
V-0104
430
11.08.26
65.680
RE-2026-0388 · Weiß
V-0122
410
07.08.26
132.795
RE-2026-0371 · Steiner
V-0130
460
02.08.26
221.630
Summe Auswahl
1.127.595
Export · PNG / PDF / XLSX / Power BI
Abweichung ggü. Prognose v7: −0,6 %

Kostenprognose statt Hochrechnung

  • Kostenprognose je Kostengruppe und für das Gesamtprojekt
  • Prognoseentwicklung im Vergleich zu früheren Versionen und Stichtagen
  • Beauftragt, bezahlt und offen jederzeit sichtbar
  • Meilenstein-Trendanalyse: Kostenentwicklung im Bezug zum Terminplan
Kosten bis Fertigstellung — Brücke vom Budget zur Prognose
Budget → Prognose (Mio. €, brutto)
Prognose v8 · 21.08.2026
186,8
99,8
44,1
42,9
−2,9
Budget
Bezahlt
Beauftragt, nicht abgerechnet
Noch nicht vergeben
Prognoseabweichung
Kosten bis Fertigstellung
89,7 Mio. €
Prognose Gesamtkosten
189,7 Mio. €
Veränderung ggü. v7
+0,9 Mio. €
Forecast
Cash Flow · Liquidity · CAPEX/OPEX

Three views of    the same money.

Cash flow, liquidity and long-run capital planning are usually three separate spreadsheets that quietly disagree. In PROBIS they are three readings of one set of transactions, which is why they cannot.


Multi-year investment and operating budgets, on the same engine

  • Multi-year and rolling budgets with annual reconciliation
  • Measure capture, prioritization and approval workflow with deadlines and escalation
  • Capital allocation analysis by ROI, urgency or value-retention potential
  • Seasonal and cyclical phasing of spend across the fiscal year
  • CAPEX/OPEX values feeding directly into cash flow and financial planning
  • Alignment with ESG, maintenance and asset strategy targets
Ten-year plan — measures by year ($k)Northeast Portfolio · spend intensity
Measure26272829303132333435Status
Roof & envelope1327041,078231449941866Approved
HVAC equipment replacement612641,29883617677286572In workflow
Elevator modernization41849513292437466198Prioritized
Energy retrofit · ESG3191,01275946225311655Approved
Facade cleaning · OPEX94949999116105110110105105Released
Parking garage structure1986711,166330215407Captured
Cell shading = spend intensity10-year total $15.9M · rolling

Cash flow that is built from the contracts, not typed into a model

  • Automated outflow planning from contract payment terms and execution timeline
  • Outstanding payables allocated to periods on rules you configure
  • Actuals vs. plan on the same curve, so drift is visible rather than calculated
  • Roll cash flow up across projects, entities or the whole portfolio
Cumulative outflow — plan vs. actual ($M)Horizon 36 months
Actual $8.1M ahead of plan
MONTH 23
M1M12M23 · todayM36

Know the day you run short  with enough notice to do something about it

  • Equity and debt draws modeled against the actual outflow forecast
  • Funding cover and headroom shown forward across the project timeline
  • Peak requirement and shortfall date identified automatically
  • Draw request packs generated from the same data the lender monitors
Funding cover — draws vs. outflow ($M)Equity-first · facility: $140.8M
Cover breached · Month 26
SHORTFALL $4.5M
M1M12M26M36
EquityDebt drawsForecast outflowHeadroom line
Forecast
CashFlow · Liquidität · CAPEX/OPEX

Drei Sichten auf     dasselbe Geld.

Cashflow, Liquidität und langfristige Investitionsplanung sind meist drei getrennte Tabellen, die unbemerkt voneinander abweichen. In PROBIS sind sie drei Auswertungen eines Datenbestands.


Mehrjährige Investitions und Betriebsbudgets in derselben Systematik

  • Mehrjährige und rollierende Budgets mit jährlichem Abgleich
  • Maßnahmenerfassung, Priorisierung und Genehmigungsworkflow mit Fristen und Eskalation
  • Mittelverwendung nach Rendite, Dringlichkeit oder Werterhaltungspotenzial
  • Saisonale und zyklische Verteilung der Ausgaben über das Geschäftsjahr
  • CAPEX/OPEX-Werte fließen direkt in Cashflow und Finanzplanung ein
  • Abstimmung mit ESG-, Instandhaltungs- und Objektstrategiezielen
Zehnjahresplan-Maßnahmen je Jahr (Tsd. €)Portfolio Nord · Ausgabenintensität
Maßnahme26272829303132333435Status
Dach & Fassade1327041,078231449941866Genehmigt
Erneuerung TGA612641,29883617677286572Im Workflow
Aufzugs­modernisierung41849513292437466198Priorisiert
Energetische Sanierung · ESG3191,01275946225311655Genehmigt
Fassadenreinigung · OPEX94949999116105110110105105Freigegeben
Parkhaus­tragwerk1986711,166330215407Erfasst
Farbintensität = Ausgabenhöhe                                                   Zehnjahressumme 14,5 Mio. € · rollierend

Cashflow aus den Verträgen, nicht aus einem Modell

  • Automatisierte Auszahlungsplanung aus Vertragskonditionen und Bauzeitenplan
  • Offene Posten werden nach Ihren Regeln auf Perioden verteilt
  • Ist und Plan in einer Kurve — Abweichungen sind sichtbar, nicht zu errechnen
  • Aggregation über Projekte, Gesellschaften oder das gesamte Portfolio
Kumulierte Auszahlungen — Plan/Ist (Mio. €)Horizont 36 Monate
Ist 7,4 Mio. € über Plan
MONAT 23
M1M12M23 · heuteM36

Den Tag der Unterdeckung kennen früh genug, um zu handeln

  • Eigen- und Fremdkapitalabrufe gegen die Auszahlungsprognose modelliert
  • Finanzierungsdeckung und Spielraum über die gesamte Projektlaufzeit
  • Spitzenbedarf und Zeitpunkt der Unterdeckung werden automatisch ermittelt
  • DrawMittelabrufe aus denselben Daten, die die Bank prüft request packs generated from the same data the lender monitors
Finanzierungsdeckung — Abrufe/Auszahlungen (Mio. €)Eigenkapital zuerst · Linie: 128 Mio. €
Deckung unterschritten · Monat 26
UNTERDECKUNG 4,1 MIO. €
M1M12M26M36
EigenkapitalFremdkapitalabrufePrognostizierte AuszahlungenDeckungslinie l
In Out
PROBIS control Live
Contracts and commitments from Contract
Invoices via upload, email or ERP
Progress and schedule data
Payment terms and loan agreements
Cost reports and variance reports
Cash-flow and liquidity forecasts
Draw requests
ERP postings and Power BI feeds
contracts invoices progress payment terms contracts →cost report invoices →cash flow progress →draw request payment terms →ERP feed
In Out
PROBIS control Live
Contracts and commitments from Contract
Invoices via upload, email or ERP
Progress and schedule data
Payment terms and loan agreements
Cost reports and variance reports
Cash-flow and liquidity forecasts
Draw requests
ERP postings and Power BI feeds
contracts invoices progress payment terms contracts →cost report invoices →cash flow progress →draw request payment terms →ERP feed

Also in Control

Task overview

Every user sees what is waiting on them, with age.

Automatic triggers

Workflows that start themselves on a defined event.

Document workflow

Upload, recognize, create, archive.

Budget revisions

Controlled, versioned, with reason codes.

Accruals and period close

For month-end and year-end reporting.

Invoice import

Bulk import via CSV or XLSX template.

Multi-project cost views

The same report across a set of projects.

Custom fields on any object

Capture what your process requires.

Permissions per cost group

External parties see only their scope.

Außerdem in Control

Aufgabenübersicht

Jeder Benutzer sieht, was ansteht — mit Liegezeit.

Automatische Auslöser

Workflows, die bei einem definierten Ereignis selbst starten.

Dokumentenworkflow

Hochladen, erkennen, erzeugen, archivieren.

Budgetfortschreibung

Kontrolliert, versioniert, mit Begründungskennzeichen.

Abgrenzung und Periodenabschluss

Für Monats- und Jahresabschluss.

Rechnungsimport

Massenimport über CSV- oder XLSX-Vorlage.

Projektübergreifende Auswertung

Derselbe Bericht über mehrere Projekte.

Eigene Felder an jedem Objekt

Erfassen, was Ihr Prozess erfordert.

Rechte je Kostengruppe

Externe Beteiligte sehen nur ihren Bereich.

110 William Street, Lower Manhattan
Case study · DATA CENTER

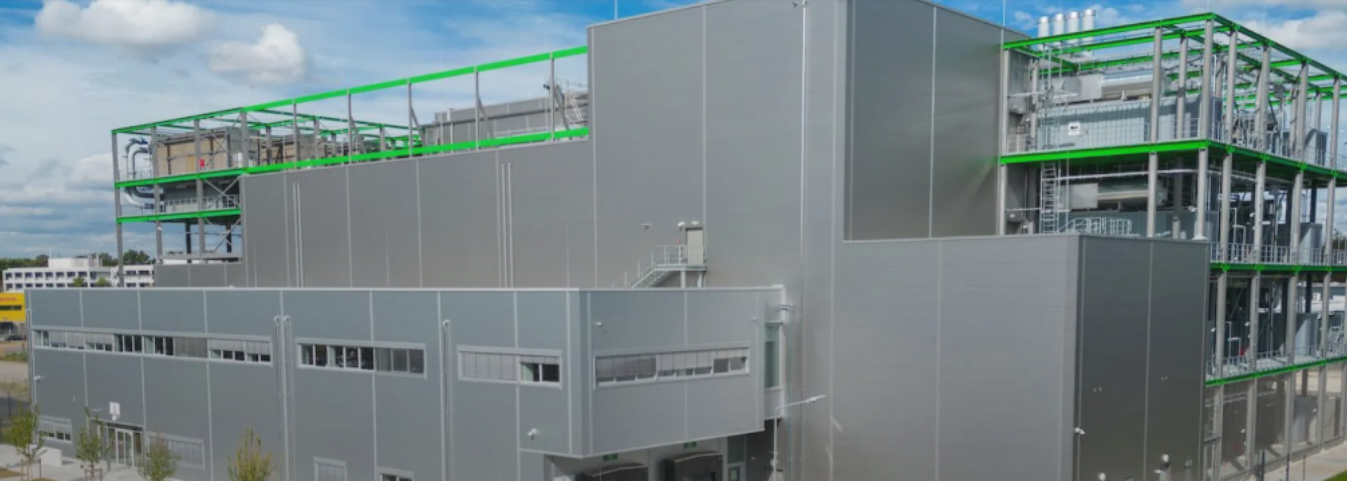
A USD 172m data center, closed within 2% of budget.

Google's data center in Hanau was developed by the NDC-GARBE joint venture, approx. 20 to 25 km from the DE-CIX internet exchange in Frankfurt. The four-floor facility covers approx. 10,000 sqm and carries approx. 15 MW of IT load, on a capex of approx. USD 172 million. PROBIS was in from pre-construction, with QS, proforma and cost control running from the start, so commitments and spend were tracked against the approved budget throughout delivery. The project was delivered on schedule and closed within approx. two percent of its approved budget.

Read the full project profile →
Capex $172M
IT load 15 MW
Final cost vs. approved budgetapprox. 2%
110 William Street, Lower Manhattan
Case study · RECHENZENTRUM

Ein Rechenzentrum mit einem Investitionsvolumen von 150 Mio. EUR – innerhalb von 2 % des Budgets abgeschlossen.

Das Rechenzentrum von Google in Hanau wurde von der NDC-GARBE Joint Venture entwickelt und liegt etwa 20 bis 25 km vom Internetknoten DE-CIX in Frankfurt entfernt. Die viergeschossige Anlage umfasst rund 10.000 m² und verfügt über eine IT-Leistung von rund 15 MW bei einem Investitionsvolumen von etwa 150 Mio. EUR. PROBIS war bereits in der Vorbereitungsphase eingebunden. QS, Proforma und Kostencontrolling liefen von Beginn an, sodass Verpflichtungen und Ausgaben während der gesamten Projektlaufzeit kontinuierlich mit dem freigegebenen Budget abgeglichen werden konnten. Das Projekt wurde termingerecht fertiggestellt und mit einer Abweichung von rund zwei Prozent vom freigegebenen Budget abgeschlossen.

Vollständiges Projektprofil lesen
Investitionsvolumenca. 150 Mio. EUR
IT-Leistungca. 15 MW
Endkosten vs. freigegebenes Budgetinnerhalb von ca. 2 %

Frequently asked questions

Frequently asked questions

How does invoice approval actually work?

An invoice is uploaded or imported, its data is recognized automatically, and it is matched to a contract and cost section. It then follows the workflow configured for that contract — one step or several, with teams assigned to each. Approvers see the amount, the contract position and the budget impact before deciding. High-volume routine invoices can be handled as a batch.

Can external parties such as lenders or monitors get access?

Yes. Permissions are role-based and scoped, so a lender or loan monitor can be given a defined view — typically draws, progress and cost position — without access to the rest of the project.

Does the cash-flow forecast update automatically?

Yes. It is derived from contract payment terms, the execution timeline, actual invoices and outstanding items, so it moves whenever those move rather than when someone rebuilds the model.

What's the difference between Control and CAPEX/OPEX?

Same engine, different horizon. Control manages the cost of a project in delivery; CAPEX/OPEX manages the multi-year investment and operating budget of assets you own and operate. Many clients run both, and the CAPEX plan feeds projects that are then delivered in Control.

Can we report by our own cost codes rather than MasterFormat?

Yes. The data cube holds all attributes on every transaction, so you can filter and report by MasterFormat division, Uniformat element, cost center, location, engineer of record, building section, contract or your own custom fields — usually in combination.

Häufige Fragen

Häufige Fragen

Wie läuft die Rechnungsfreigabe konkret ab?

Die Rechnung wird hochgeladen oder importiert, ihre Daten werden automatisch erkannt und einem Vertrag sowie einem Titel zugeordnet. Anschließend läuft sie durch den für diesen Vertrag konfigurierten Workflow — ein- oder mehrstufig, mit zugewiesenen Teams. Die Freigebenden sehen Betrag, Vertragsstand und Budgetwirkung vor ihrer Entscheidung. Standardrechnungen in großer Zahl können als Sammellauf bearbeitet werden.

Können externe Beteiligte wie Banken oder Controller Zugriff erhalten?

Ja. Die Rechte sind rollenbasiert und auf den jeweiligen Bereich begrenzt. Eine Bank oder ein externer Controller erhält eine definierte Sicht — üblicherweise Mittelabrufe, Baufortschritt und Kostenstand — ohne Zugriff auf das übrige Projekt.

Aktualisiert sich die Cashflow-Prognose automatisch?

Ja. Sie leitet sich aus Vertragskonditionen, Bauzeitenplan, eingegangenen Rechnungen und offenen Posten ab und verändert sich, sobald sich diese verändern — nicht erst, wenn jemand das Modell neu aufbaut.

Worin unterscheiden sich Control und CAPEX/OPEX?

Gleiche Systematik, anderer Horizont. Control steuert die Kosten eines Projekts in der Umsetzung; CAPEX/OPEX steuert das mehrjährige Investitions- und Betriebsbudget von Objekten in Ihrem Bestand. Viele Kunden nutzen beides: Aus dem CAPEX-Plan entstehen Projekte, die dann in Control abgewickelt werden.

Können wir nach eigenen Kostenstellen statt nach DIN 276 auswerten?

Ja. Der Datenwürfel hält alle Merkmale zu jedem Vorgang. Sie können nach DIN-276-Kostengruppe, Kostenstelle, Bauteil, Fachplaner, Bauabschnitt, Vertrag oder eigenen Feldern filtern und auswerten — in der Regel in Kombination.

Next in the lifecycle
Weiter im Projektzyklus

Bring us    last month's cost report.

We'll show you how long it takes to produce the same thing in PROBIS and what else you would have seen.

Bringen Sie un    Ihren letzten Kostenbericht.

Wir zeigen Ihnen, wie lange die Erstellung in PROBIS dauert und was Sie darin zusätzlich gesehen hätten.

ISO/IEC 27001:2022 certifiedCertified · Audit-readyISO/IEC 27001 certifiedAnnual AuditRole-based permissionsLearn more
ISO/IEC 27001:2022 certifiedCertified · Audit-readyISO/IEC 27001 certifiedJahrish gepruftRollenbasierte ZugriffsrechteLearn more